- Preview
-
- Title
-
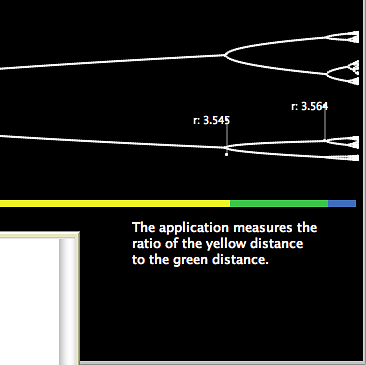
Universality in the Logistic Map: Feigenbaum's constants
- Series
- Dynamics and Chaos
- Description
- This model illustrates one of Feigenbaum;s constants. The bifurcation diagram is shown at various resolutions and the user picks points to measure the ratio of change in parameter r from one bifurcation to the next. Writeup for this model is attached to Emergent Logistic Growth model.
- NetLogo source file
- simple-bifurcation-diagram-feigenbaum.nlogo